Read the risk heat map
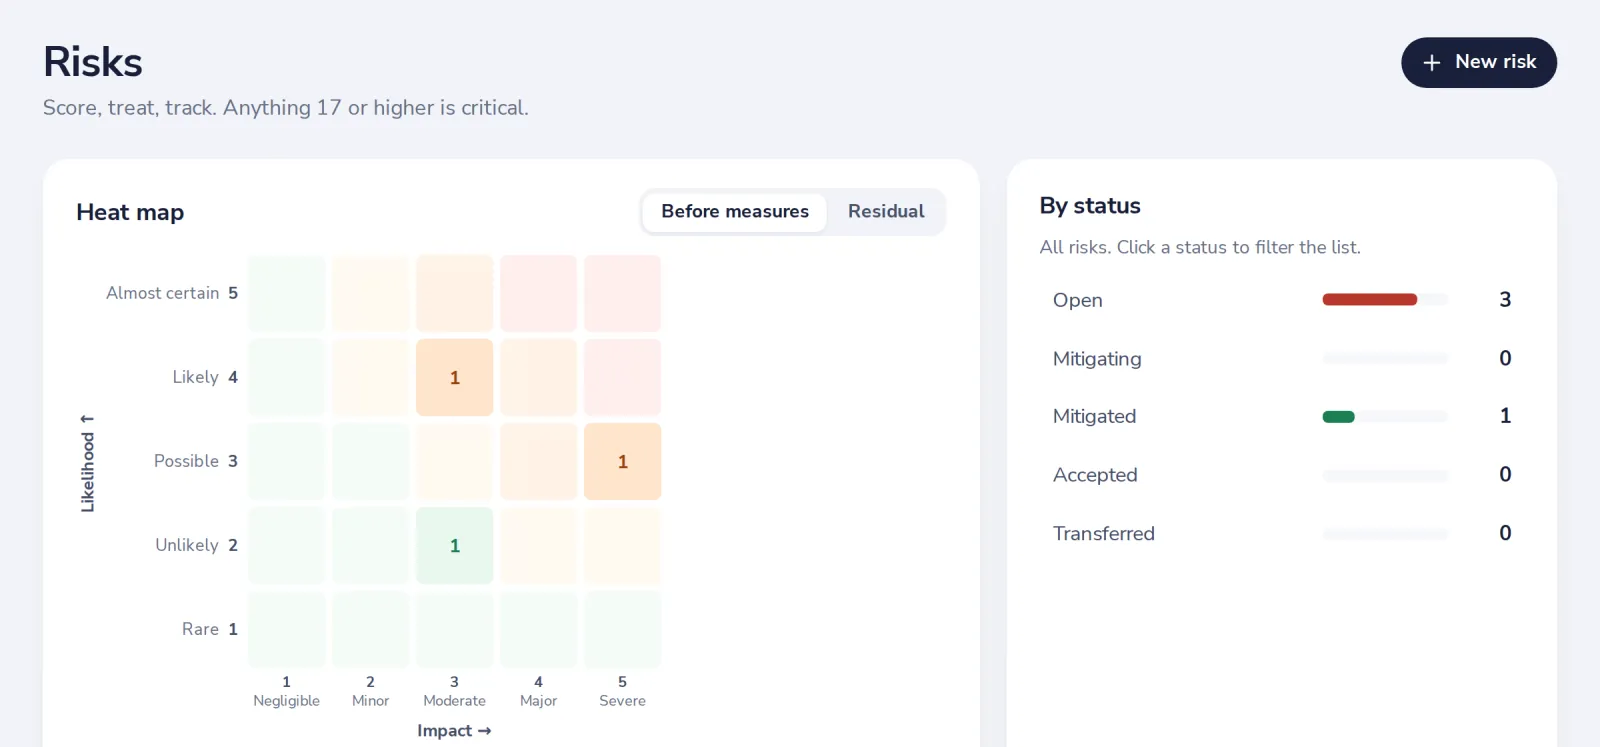
The heat map places every open risk by how likely and how bad it is. The darker the square, the higher the score.
- 1
Look at the heat map
Each number is how many risks sit in that square. Click a square to filter the list.
- 2
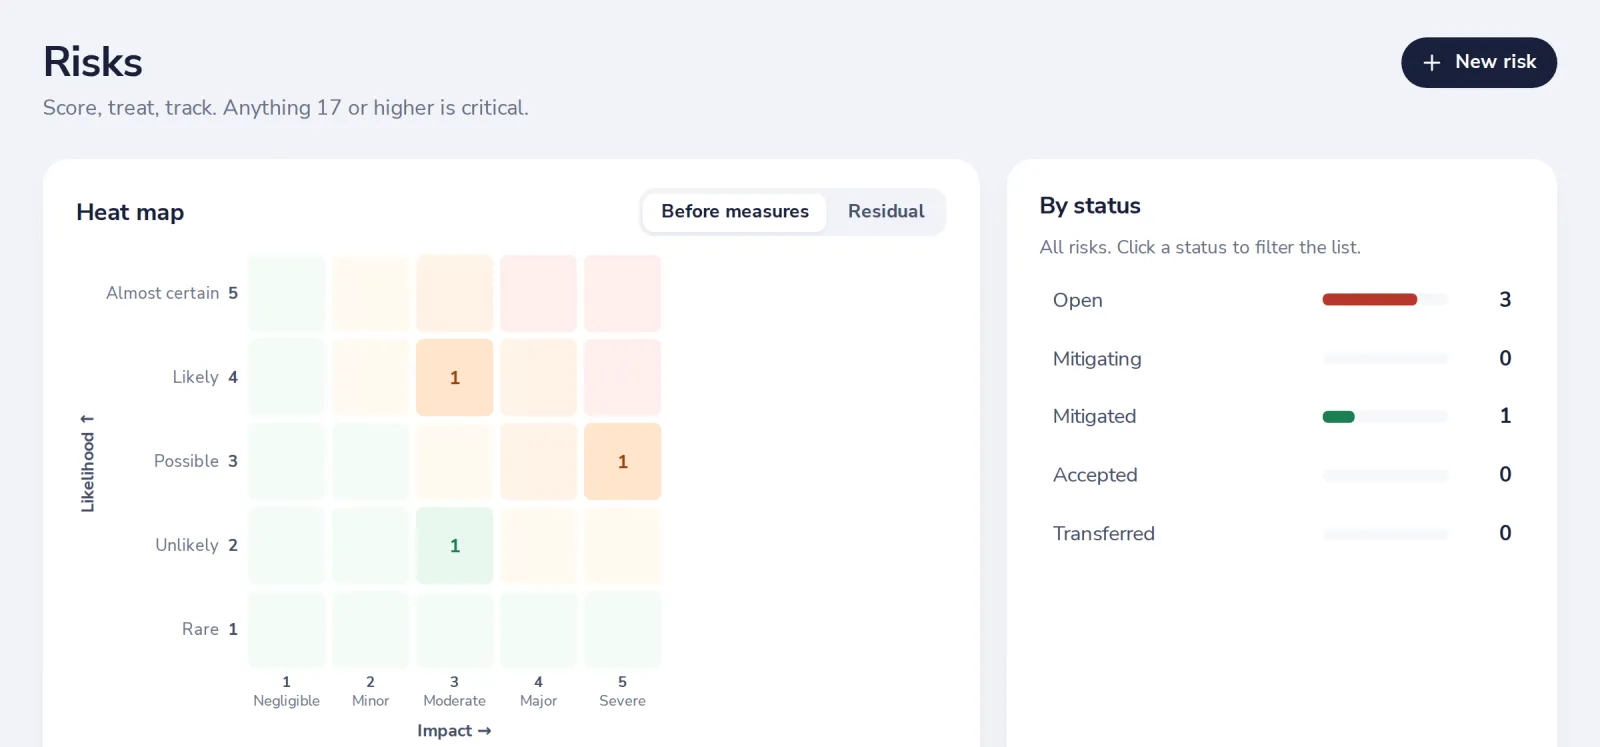
Switch between before measures and residual risk
Residual shows the risk that is left after your measures.
- 3
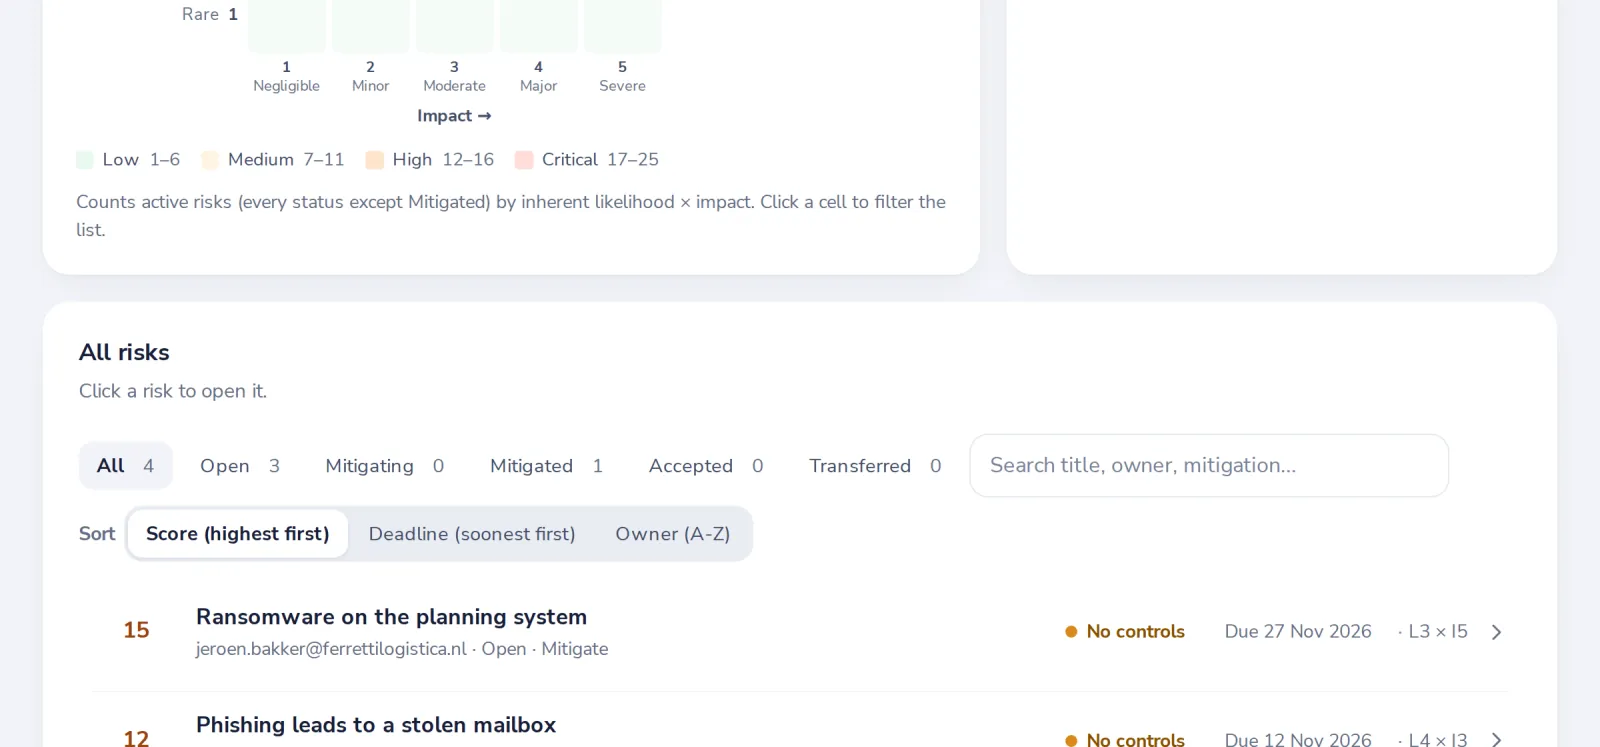
See the list by score
All risks, highest score first. Click one to change it.
Was this helpful?
What was missing?
Thank you.
We count yes and no per article. Nothing about you is stored.