Read a dashboard
Every chart counts what happened in your organisation's Dazr apps over the period at the top. Here is how to read the numbers, see what each one counts, and why some stay hidden.
- 1
Read the big numbers
The total for the period, with the change since the period before it. The word says which way it went.
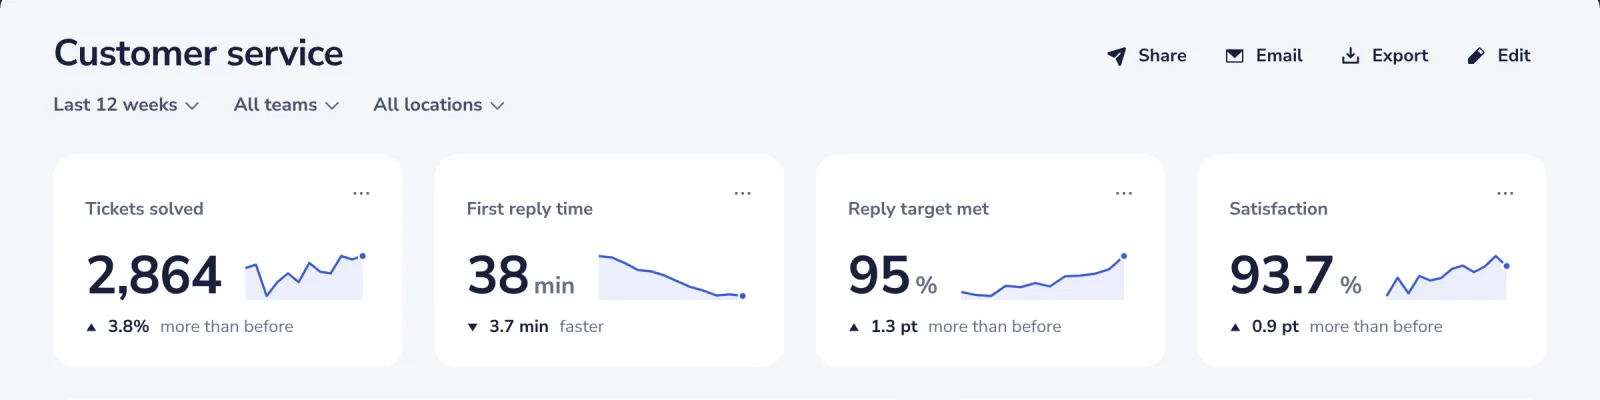
Faster, slower, more or less is said in words, so the colour never has to tell you.
- 2
See what a chart counts
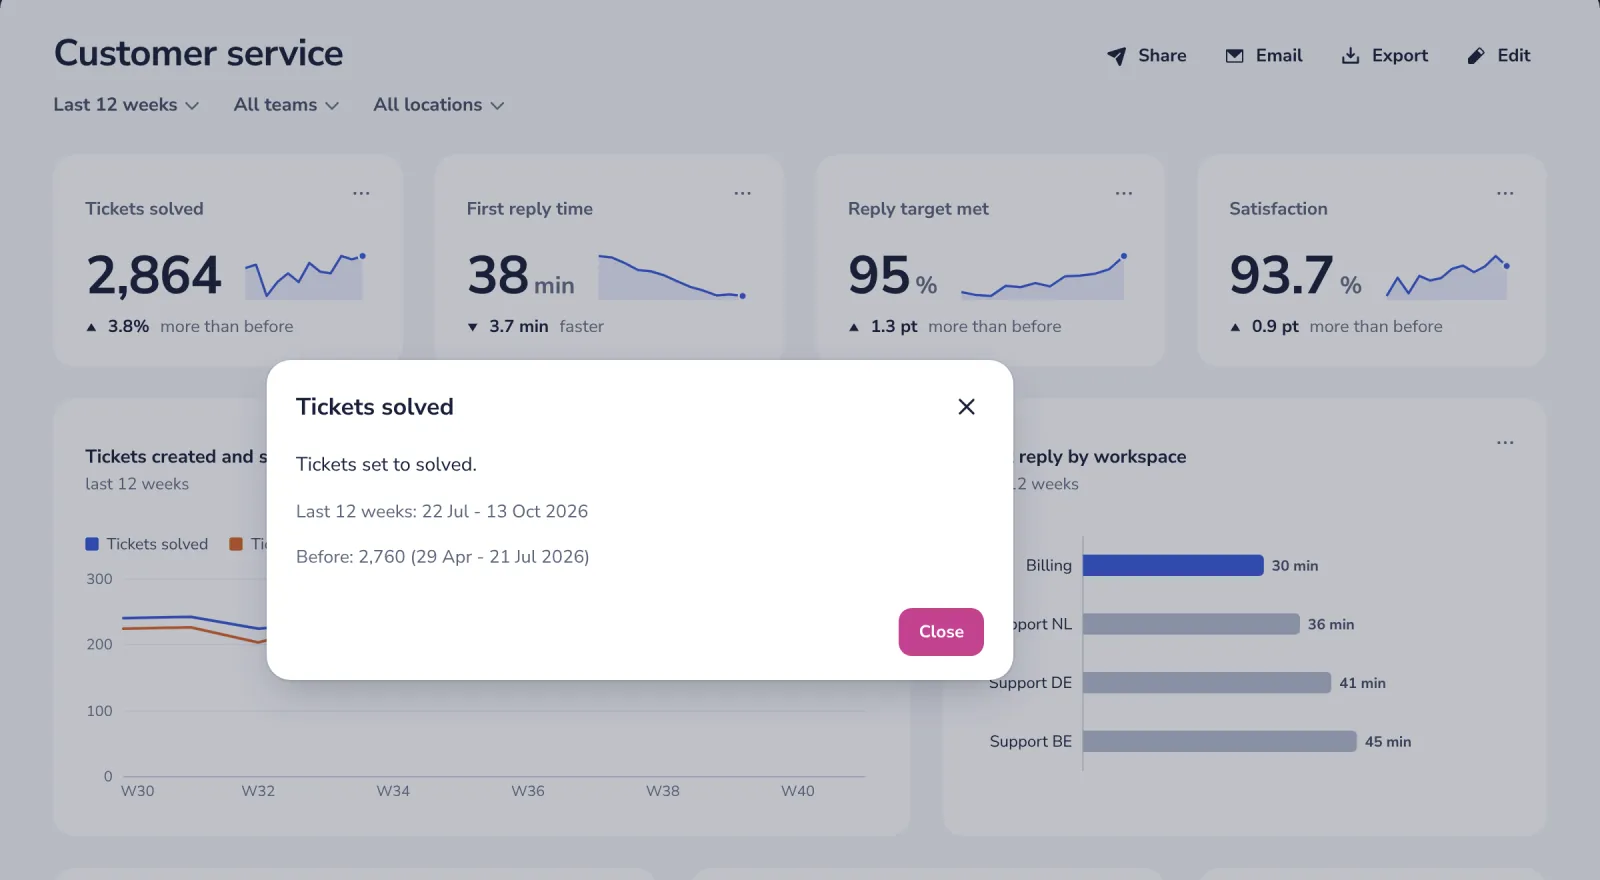
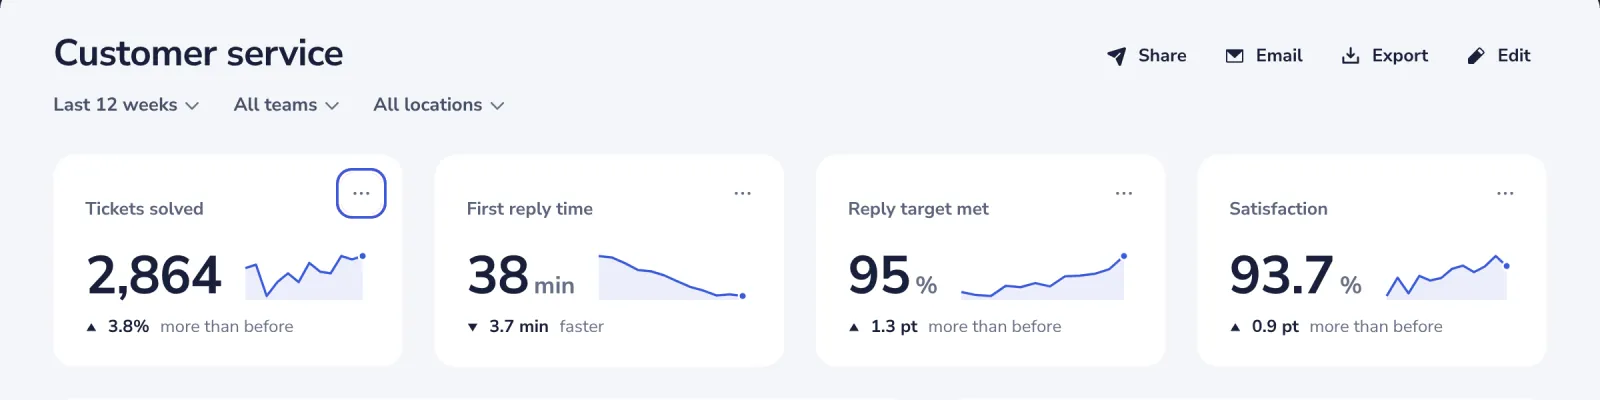
Open a chart's three dots and press About this chart. It says what is counted, the dates and the number before.
- 3
Change the period
The period at the top applies to every chart, except a chart that was given a period of its own.
- 4
Know why a number is hidden
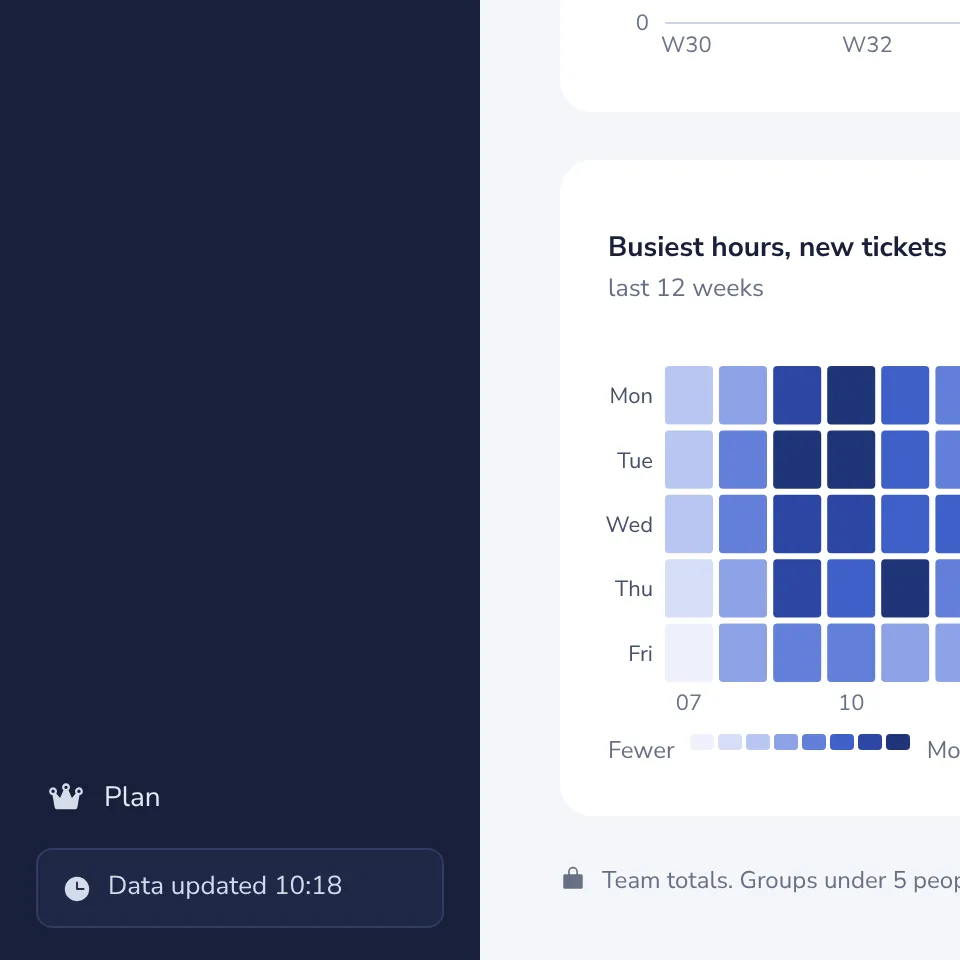
A team or group of fewer than 5 people never shows its numbers. Smaller groups are counted together.
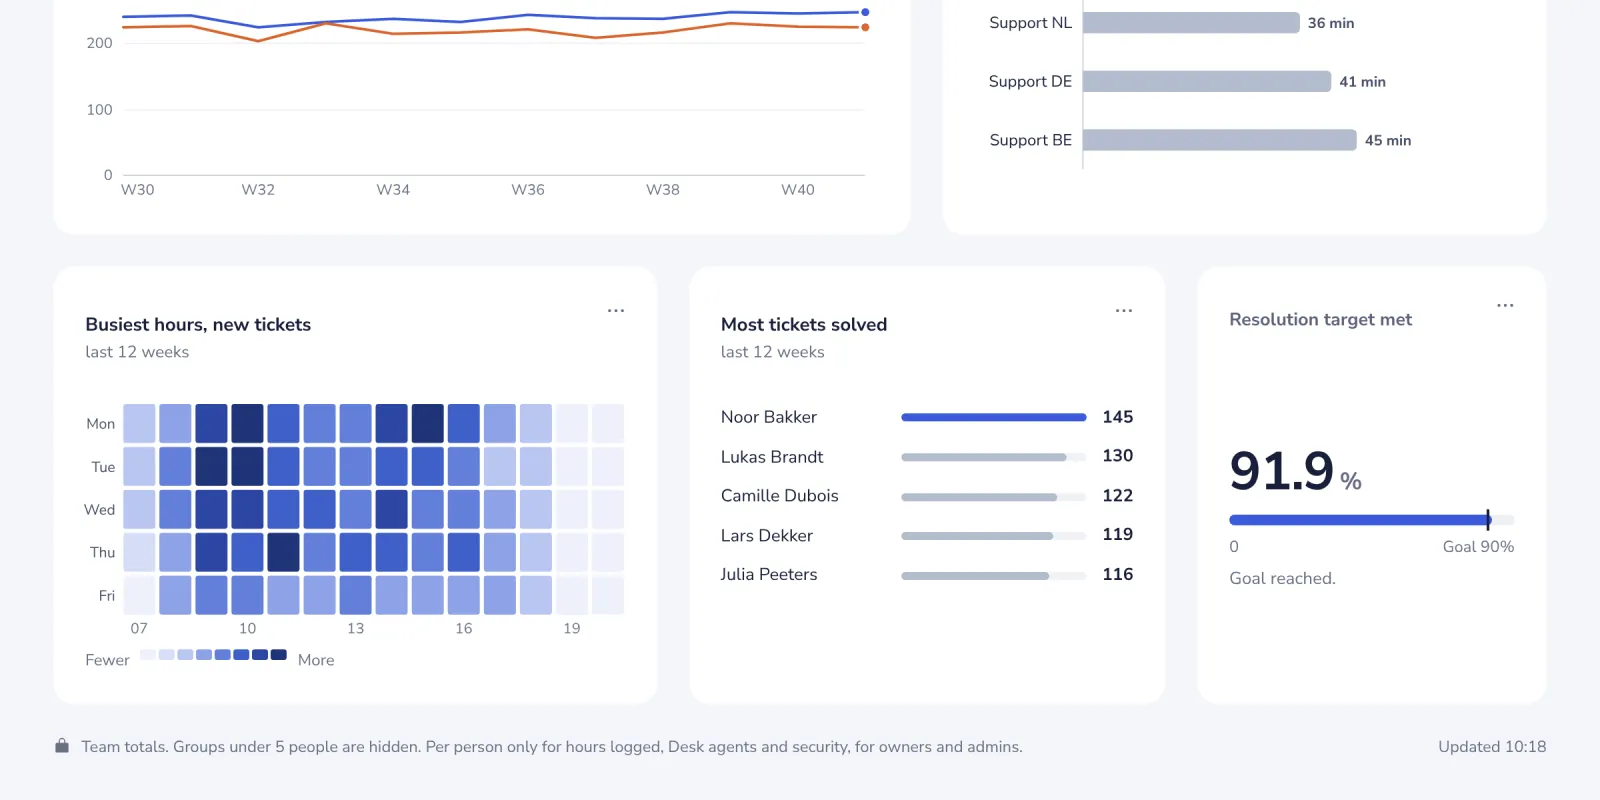
The line at the bottom of the dashboard says what you are allowed to see.
- 5
Check when the numbers were counted
At the bottom of the side panel. Analytics counts again every day.
Was this helpful?
What was missing?
Thank you.
We count yes and no per article. Nothing about you is stored.