Add a chart to a dashboard
The builder asks what you want to see, split by what, for which period and how it should look. The preview shows your own numbers at every step.
- 1
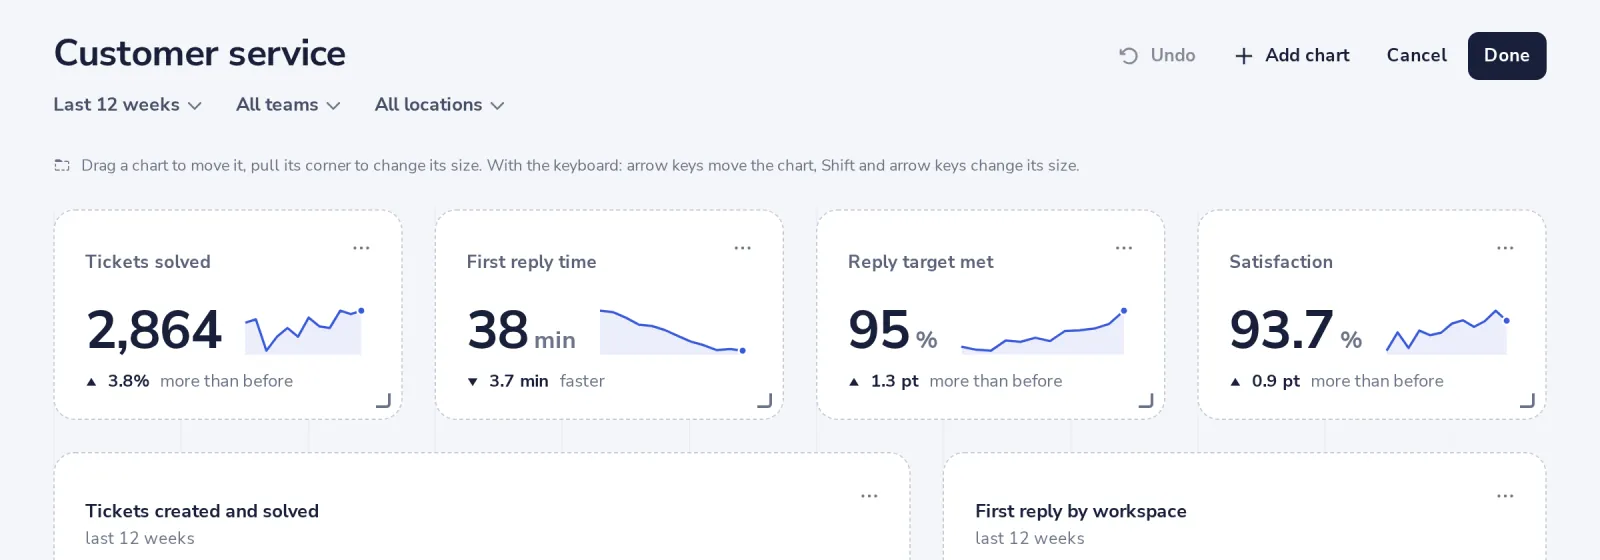
Press Edit, then Add chart
At the top of the dashboard. In edit mode you can also drag charts and change their size.
- 2
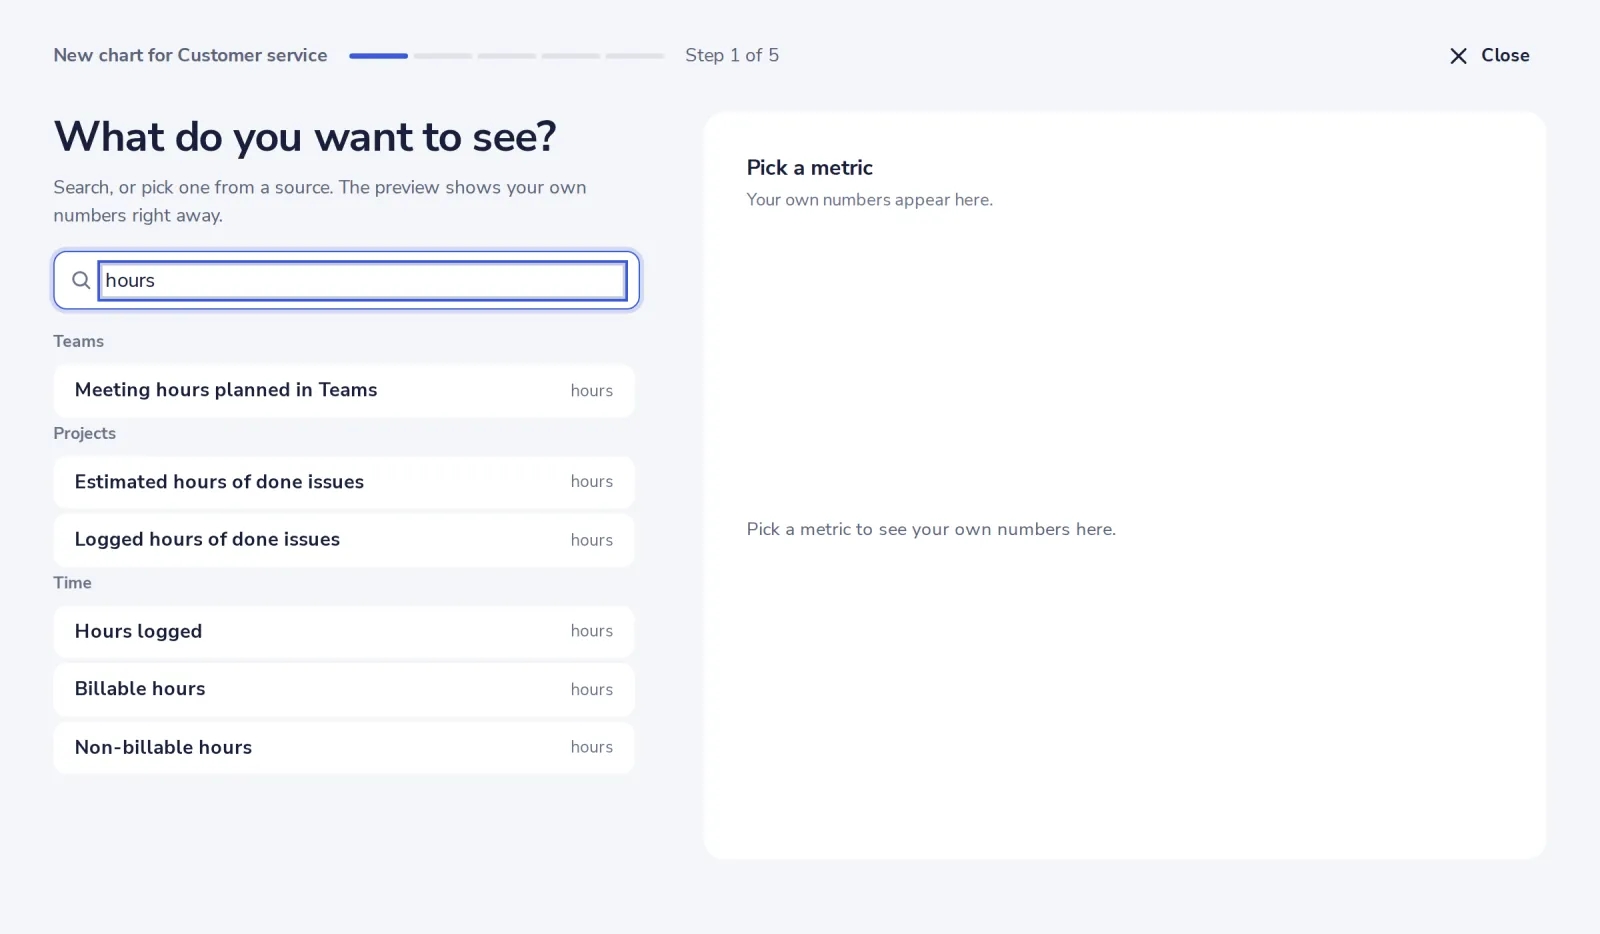
Pick what you want to see
Search, or pick a metric from a source, like Hours logged from Time.
- 3
Answer the next questions
Split it by what, which period and how it looks. The preview follows each choice.
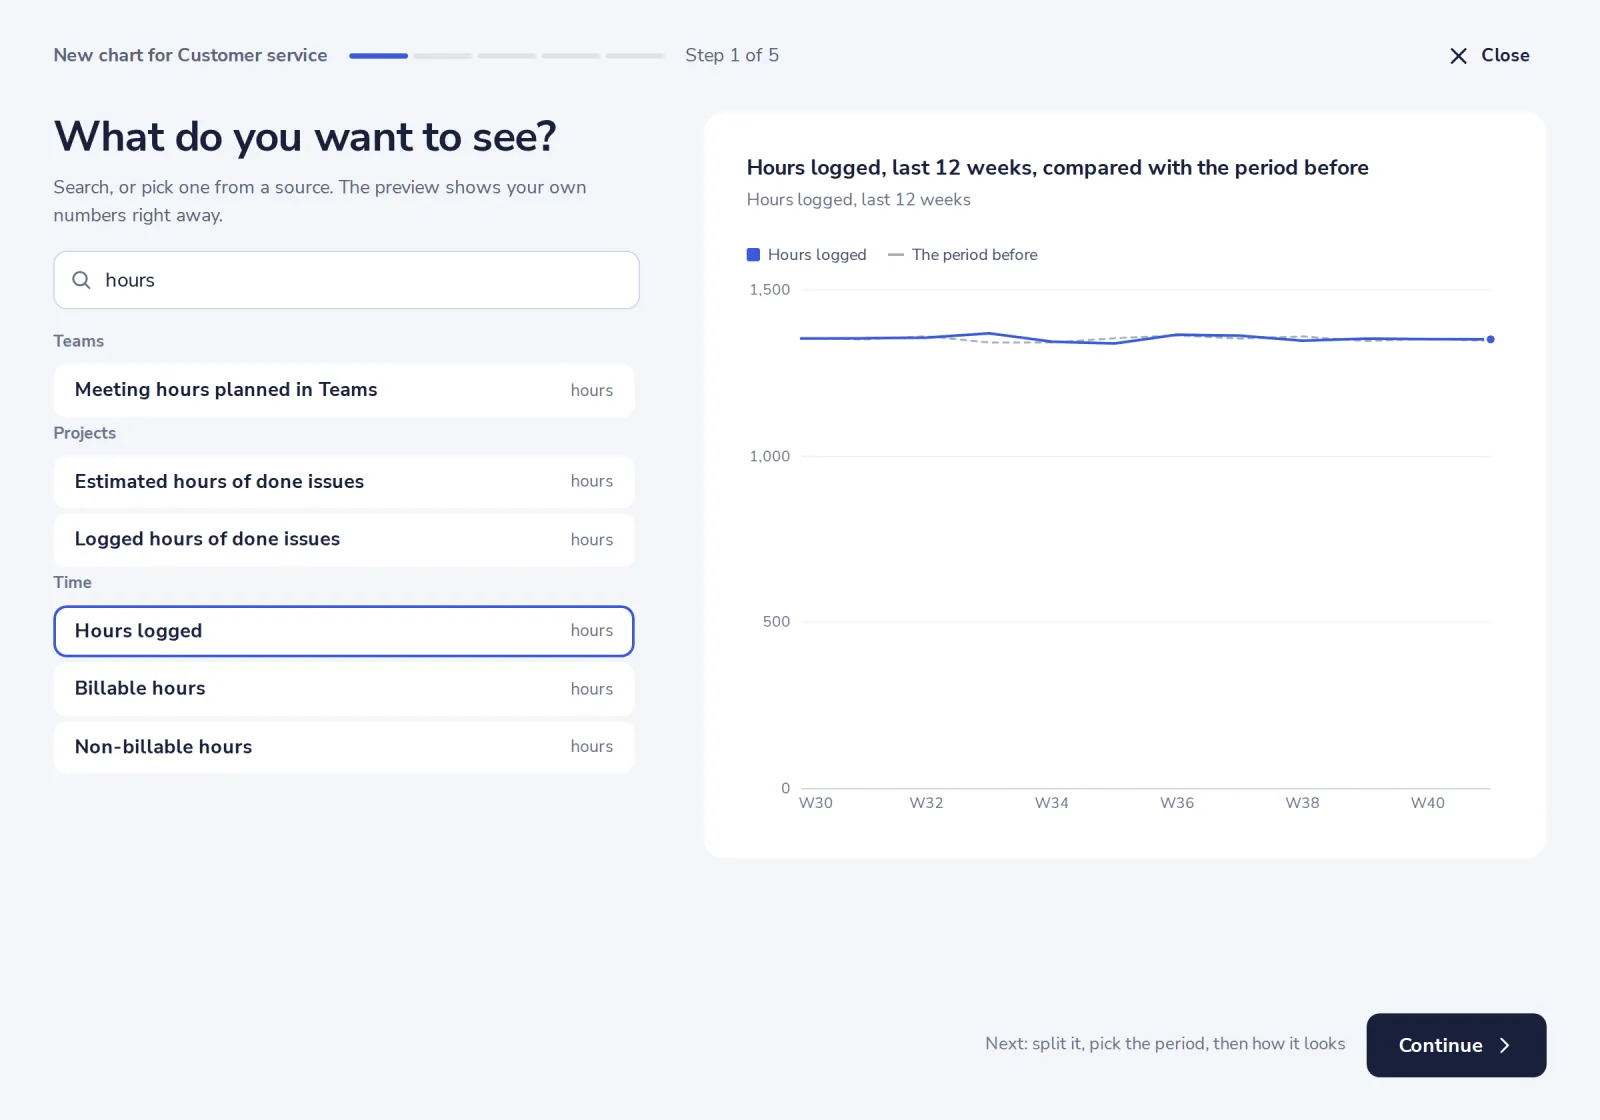
More options has several metrics in one chart, filters, a comparison with the period before or a target, and a pivot.
- 4
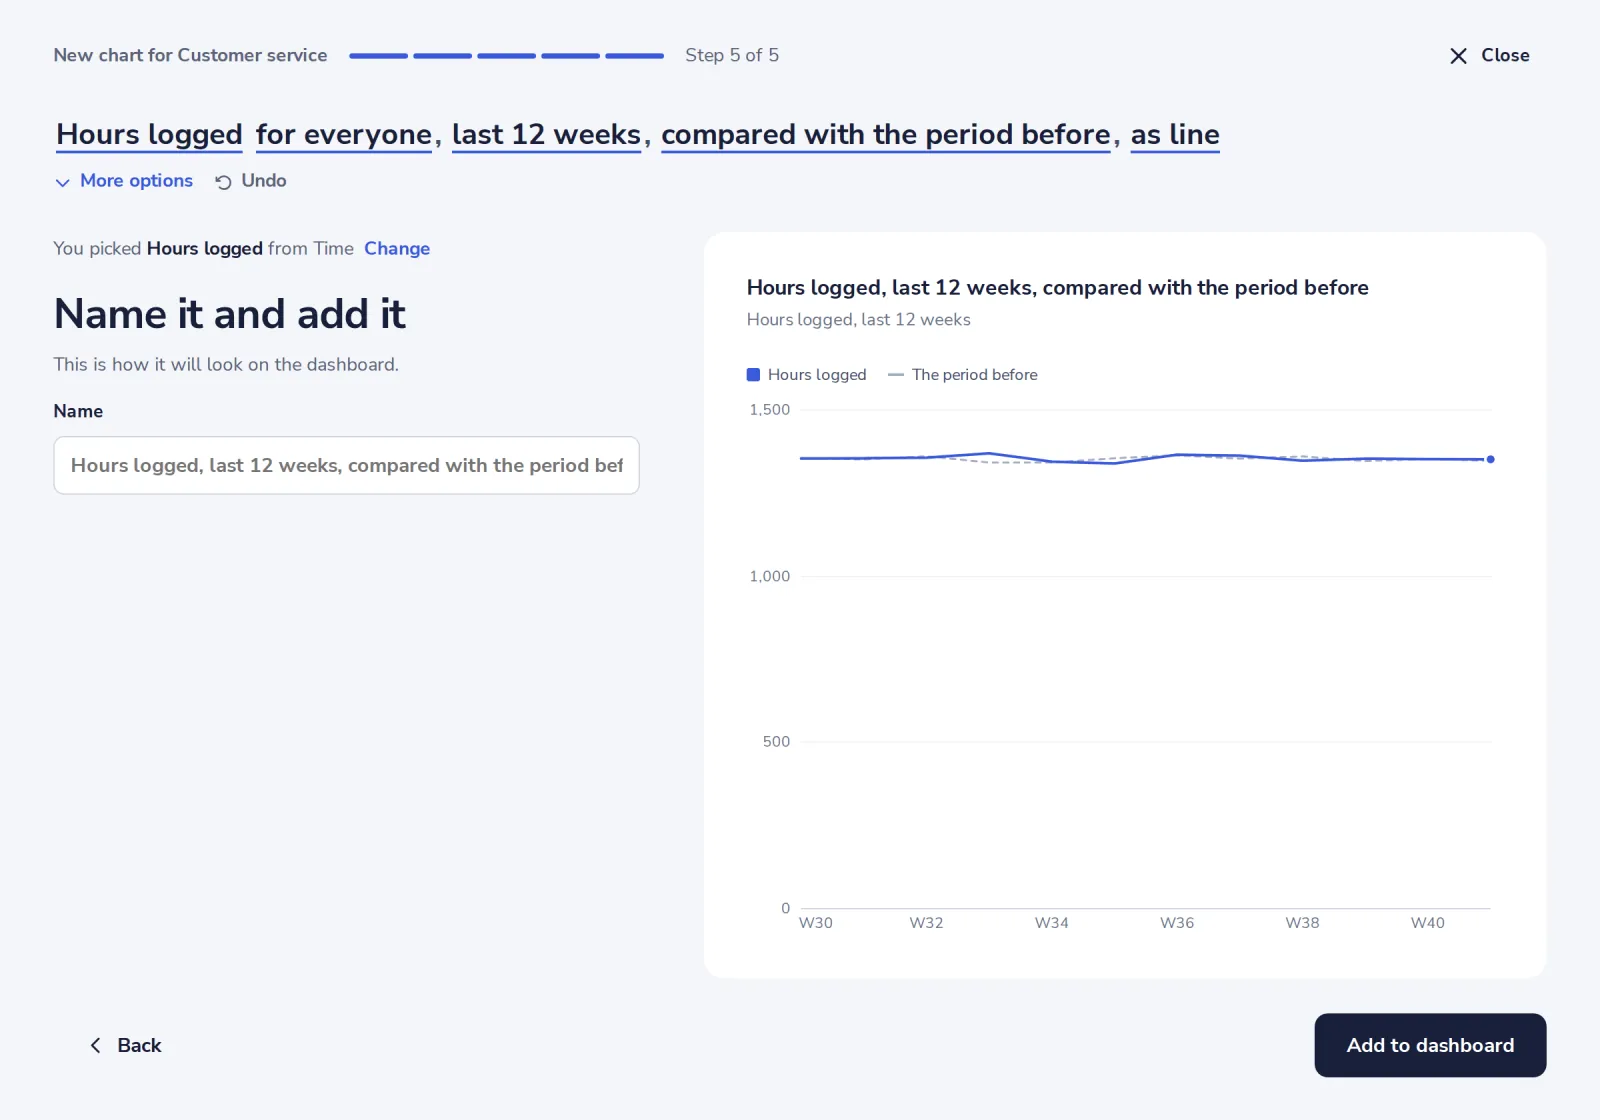
Name it and add it
Add to dashboard puts the chart on the dashboard you came from.
Was this helpful?
What was missing?
Thank you.
We count yes and no per article. Nothing about you is stored.